AWS Step-by-Step
Monitoring EC2 Instances with Amazon CloudWatch
To ensure that the virtual machines (VMs) running in their private datacenters are performing as intended, organizations commonly monitor them using the Windows Performance Monitor or third-party tools.
Just because a workload has been moved to the public cloud, doesn't mean that the need for monitoring workload performance goes away. As such, Amazon Web Services (AWS) provides a tool called CloudWatch that administrators can use to track VM performance.
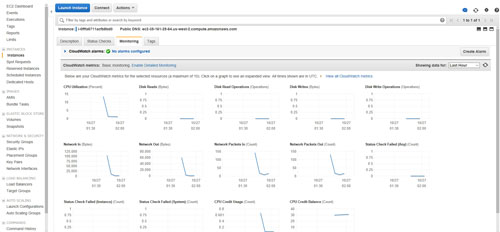
The first thing you must understand about CloudWatch is that it supports two different types of monitoring for EC2 instances: basic monitoring and detailed monitoring. If you look at Figure 1 below, you can see that I have logged into the Elastic Compute Cloud (EC2) console and created an instance. With the instance selected, I clicked on the Monitoring tab in the bottom half of the screen. This tab displays four charts, which are designed to display CloudWatch metrics. If you take a closer look, however, you will notice that the Monitoring column for the EC2 instance shows a status of Disabled. You will also notice that there is a link just above the charts that you can use to enable detailed monitoring.
 [Click on image for larger view.] Figure 1: CloudWatch can provide basic or detailed monitoring.
Basic monitoring capabilities are built into the cost of EC2 instances. Data is made available in five-minute increments at no extra charge. Conversely, detailed monitoring is performed in one-minute increments, but AWS charges extra for detailed monitoring. Incidentally, if you are using auto scaling, then detailed monitoring can provide aggregate performance metrics across the auto scaling group.
Although the CloudWatch metrics that are displayed by default can be helpful, the EC2 console allows you to view significantly more information. If you look at Figure 2, you can see 14 different metrics for the currently selected EC2 instance. You will also notice that although most of these metrics are directly related to performance, there are also a couple of metrics for monitoring CPU credit.
 [Click on image for larger view.] Figure 2: There are a number of different metrics that you can monitor for an EC2 instance.
If you need to view more detail than what is shown in Figure 2 above, simply click on a metric. Doing so enlarges the chart to show more detail. As you can see in Figure 3 below, the resulting window contains a series of drop-down options that you can use to adjust the chart view. You can choose the type of statistics shown in the chart, the time range and the sample period.
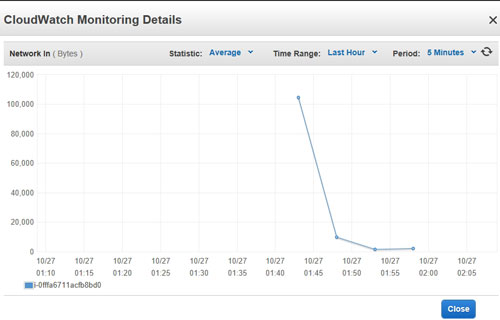 [Click on image for larger view.] Figure 3: Click on a chart to see a larger, more detailed view.
As helpful as the view shown in Figure 3 can be, most administrators don't spend their days looking at performance charts for individual EC2 instances. The charts can be useful if you are trying to quantify the performance of a specific instance, but the view isn't really practical for monitoring large numbers of instances. As such, AWS makes it possible to set up CloudWatch alarms. You can create an alarm by clicking on the Create Alarm button, also shown in Figure 3.
I don't want to spend too much time talking about alarms because I have discussed them at length in recent columns (see here and here). The basic idea, however, is that an alarm can send a notification to an administrator or take some sort of corrective action if a predetermined threshold value is exceeded. As you can see in Figure 4, alarms can be matched to any of the metrics shown in Figure 2 earlier.
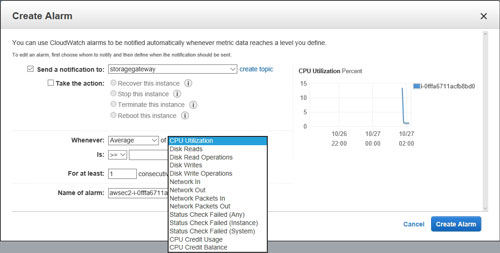 [Click on image for larger view.] Figure 4: Alarms can be used to notify you of performance problems and to take automated, corrective action.
One last thing that I want to mention about CloudWatch is that it has uses beyond monitoring EC2 instances. As such, CloudWatch is accessible from the Management Tools section of the AWS home screen. The reason I am telling you this is because accessing CloudWatch through the AWS home screen takes you to a CloudWatch interface that is not rigidly tied to an EC2 instance. This tool provides an aggregate view of CloudWatch alarms, billing information, rules, metrics and more. You can even create your own custom CloudWatch dashboards.
To show you what I mean, take a look at Figure 5 below. In this figure, I have created a custom dashboard called Briens-Dashboard. The dashboard includes a chart containing multiple data metrics. I could add additional charts if I wanted to, or even text widgets. The figure also contains an alarm summary. Right now, there are three alarms for which there is insufficient data.
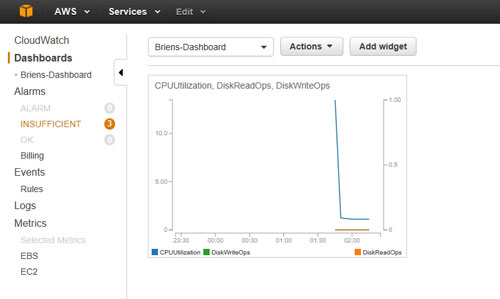 [Click on image for larger view.] Figure 5: The CloudWatch tool lets you customize the way in which monitoring data is displayed.
As you can see, CloudWatch is a very flexible tool that allows administrators to monitor instances according to their own unique requirements. AWS enables monitoring by default for EC2 instances, and more detailed monitoring is available at an extra cost.
About the Author
Brien Posey is a 22-time Microsoft MVP with decades of IT experience. As a freelance writer, Posey has written thousands of articles and contributed to several dozen books on a wide variety of IT topics. Prior to going freelance, Posey was a CIO for a national chain of hospitals and health care facilities. He has also served as a network administrator for some of the country's largest insurance companies and for the Department of Defense at Fort Knox. In addition to his continued work in IT, Posey has spent the last several years actively training as a commercial scientist-astronaut candidate in preparation to fly on a mission to study polar mesospheric clouds from space. You can follow his spaceflight training on his Web site.