AWS Step-by-Step
Using AWS for Network Endpoint Monitoring
Although countless tools exist for monitoring the health of resources that are located in our own datacenters, many such tools do not work for monitoring resources residing in the public cloud. Thankfully, Amazon Web Services (AWS) provides a suite of health-check tools that it collectively refers to as Route 53.
One of the simplest but most useful things that you can do using Route 53 is monitor endpoint availability. In this column, I will show you how.
Before I get started, I need to point out that Route 53 is primarily designed for monitoring resources that are being hosted on AWS. This isn't to say that you can't monitor non-AWS resources; you can. It's just that AWS charges an extra fee for monitoring external resources. The difference in cost works out to about $0.25 per health check per month, and $1 per month for each optional feature that is used. Keep in mind that this is on top of the basic health-check rate. You can find detailed pricing information for AWS health checks here.
To monitor an endpoint, such as a Web server, log in to the AWS console and then click on the Route 53 link, located in the Network & Content Delivery section. Upon doing so, you will be presented with the AWS Route 53 splash screen, which lists the various Route 53 functions. Click the Get Started Now button that is located in the Availability Monitoring section, as shown in Figure 1.
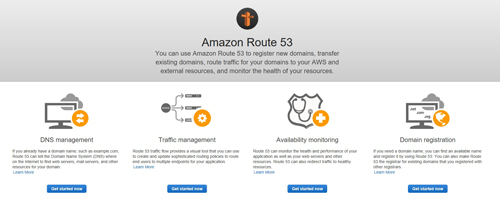 [Click on image for larger view.] Figure 1: Click the Get Started Now button located in the Availability Monitoring section.
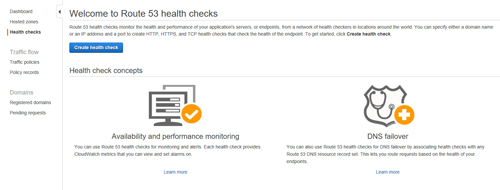
At this point, you will be taken to the Welcome to Route 53 Health Checks screen, shown in Figure 2. As you can see in the figure below, this screen allows you to set up availability monitoring, performance monitoring and DNS failover. To get started, click on the Create Health Check button.
 [Click on image for larger view.] Figure 2: Click the Create Health Check button to get started.
At this point, you will be taken to the screen that allows you to define the actual health check. The first thing that you will have to do is to enter a name for the check. This is just a friendly name that is designed to help you to differentiate between the various health checks that you might set up. You can use any name that you want, so long as the name isn't already in use.
Next, you will need to tell AWS what to monitor. Since we are currently focusing on endpoint monitoring, choose the Endpoint option, shown in Figure 3.
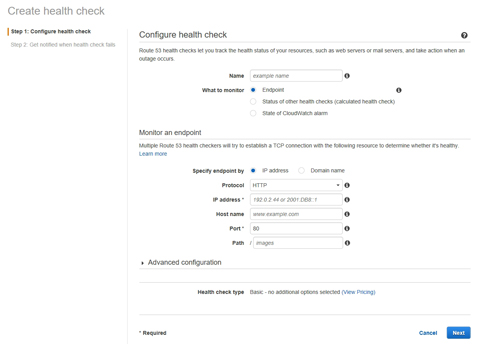 [Click on image for larger view.] Figure 3: Choose the Endpoint option within the What to Monitor section.
Now you will need to provide some information about the endpoint that you wish to monitor. You can specify the endpoint by either its fully qualified domain name or by its IP address.
You can also select the protocol that you wish to use for monitoring the endpoint. If the endpoint is a Web site, then the default option (HTTP) is probably going to be appropriate, but HTTP is not your only available option. You can also use HTTPS or TCP. Unfortunately, AWS does not currently support other common protocols such as SMTP or FTP.
If you look back at Figure 3, you will notice that the interface also contains a port option. The Port field is populated automatically based on the monitoring protocol that you choose. However, you can specify a custom port number if necessary.
AWS also gives you the option of monitoring a specific path on the endpoint. For example, if I wanted to monitor my own Web site, I could enter www.BrienPosey.com. If, however, I wanted to monitor the page on my Web site that is dedicated to my commercial astronaut training, then I would enter www.brienposey.com as the domain and space as the path.
Of course, you don't necessarily have to create a basic endpoint check; you can create an advanced check instead. If you look back at Figure 3, you will notice an Advanced Configuration section. Expanding this section reveals options related to things like failure thresholds, health-check regions and request intervals. You can see the available options in Figure 4. Keep in mind, however, that AWS charges a premium for using advanced features.
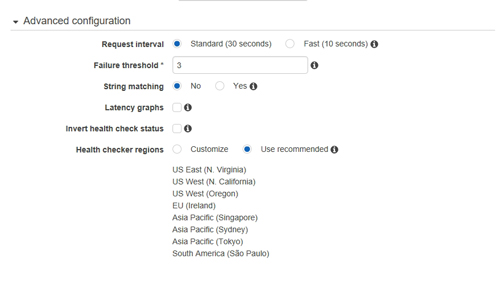 [Click on image for larger view.] Figure 4: There are a number of advanced options that you can use.
Once you have populated the various configuration options, click Next to go to the next step. Now, just click either Yes or No to choose whether to create an alarm. Finally, click the Create Health Check button, shown in Figure 5 below.
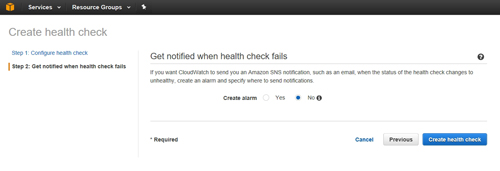 [Click on image for larger view.] Figure 5: You have the option of creating an alarm for the health check.
About the Author
Brien Posey is a 22-time Microsoft MVP with decades of IT experience. As a freelance writer, Posey has written thousands of articles and contributed to several dozen books on a wide variety of IT topics. Prior to going freelance, Posey was a CIO for a national chain of hospitals and health care facilities. He has also served as a network administrator for some of the country's largest insurance companies and for the Department of Defense at Fort Knox. In addition to his continued work in IT, Posey has spent the last several years actively training as a commercial scientist-astronaut candidate in preparation to fly on a mission to study polar mesospheric clouds from space. You can follow his spaceflight training on his Web site.