AWS Step-by-Step
Measuring Network Performance Across AWS Regions and Availability Zones
Mission-critical workloads running in the AWS cloud are almost always designed so that they span multiple regions and / or availability zones. That way, if a problem were to occur in one location, the workload can continue running in another. Of course, in order to make this work you will need reliable network connectivity between regions or availability zones, and this connectivity must deliver a certain level of performance. Thankfully, Amazon provides an easy way to look at network latency and performance between regions or availability zones.
To get started, open the Network Manager console. Next, click on the Infrastructure Performance tab, which is located in the Monitoring and Troubleshooting section. This will cause AWS to open the Infrastructure Performance window.
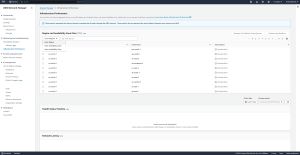
The next thing that you will need to do is to decide whether you want to analyze network performance between regions, between availability zones, or within an availability zone. By default, the console is configured to examine network performance between regions, but you can change this easily enough. If you look at Figure 1, you can see that the console's Region and Availability Zone Pairs section contains a drop down menu, which is currently set to Inter-Region. You can change the value to Inter-Availability Zone or Intra-Availability Zone, as shown in the figure.
 [Click on image for larger view.] Figure 1: Choose whether you want to examine network performance between regions, between availability zones, or within an availability zone.
One of the things that you might have noticed about the figure above is that by default, the console lists all region or availability group pairs. This can be a really long list. The list of inter-availability zones for example, spans 21 pages! That being the case, I recommend using the search interface to find whatever it is that you are looking for, Let me show you how this works.
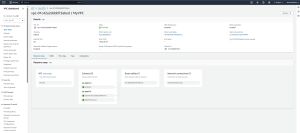
In my own AWS environment, I have a VPC containing subnets that reside in two different availability groups. As you can see in Figure 2, I have a subnet in US-East-1A and a couple of subnets in US-East-1F. So let's take a look at how we might analyze the network performance between these two subnets.
 [Click on image for larger view.] Figure 2: I have subnets in US-East-1A and US-East-1F.
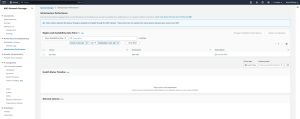
To analyze the performance between these subnets, I would go to the AWS Network Manager console and select the Inter-Availability Zone option. From there, I would click on the Search Box (which is labeled Find Metrics) and choose the Source option and then set the source to USE1-AZ1, which is short for US East 1 Availability Zone 1. Next, I would click on the search box, choose the Destination option, and then set the destination to USE1-AZ6. In reality, I am looking at traffic between US-East-1A and US-East-1F. However, the search box does not list these availability zones as A-F, instead, it uses 1-6, where 1=A, 2=B, and so on. You can see what the applied filter looks like in Figure 3.
 [Click on image for larger view.] Figure 3: I have applied a filter to narrow down the list of availability zone pairs.
The next thing that you have to do is to decide on the time period for which you want to analyze the network performance. To do so, click on the Pick a Date button, shown in the previous figure, and then choose a date to look at. By default, the console displays data from the last hour, but other options are available. You can look at anything from the last half hour to the last week. If these options do not meet your needs, then click on the Absolute Range button (which is only exposed when you click on the Pick a Date button) and then you will be given the option to choose a specific range from a calendar.
Once you have chosen the time range that you want to examine, you can choose the period for your query. The period defaults to showing you a data samples that are taken at five minute intervals for your chosen range, but you can adjust these intervals up or down based on your needs.
When you are done, select the check box corresponding to your chosen region or availability zone pair and then click on the Update Visualizations button. This will cause the console to display a health status timeline and a network latency timeline. The health status timeline, which you can see in Figure 4, categorizes network performance as being either healthy or degraded. The network latency timeline shows you the measured latency over a period of time.
 [Click on image for larger view.] Figure 4: The Network Manager console displays a health status timeline and a network latency timeline.
About the Author
Brien Posey is a 22-time Microsoft MVP with decades of IT experience. As a freelance writer, Posey has written thousands of articles and contributed to several dozen books on a wide variety of IT topics. Prior to going freelance, Posey was a CIO for a national chain of hospitals and health care facilities. He has also served as a network administrator for some of the country's largest insurance companies and for the Department of Defense at Fort Knox. In addition to his continued work in IT, Posey has spent the last several years actively training as a commercial scientist-astronaut candidate in preparation to fly on a mission to study polar mesospheric clouds from space. You can follow his spaceflight training on his Web site.