News
With X-Ray, AWS Gives Devs In-Depth Debugging
Amazon Web Services (AWS) this week announced the preview of a new service that gives developers a detailed map of their applications' innards for better troubleshooting.
Werner Vogels, Amazon.com CTO, unveiled AWS X-Ray during his re:Invent keynote in Las Vegas on Thursday, calling it "one of the coolest releases that I could think of."
X-Ray gives developers a visual interface to analyze and debug their distributed apps. The service lets developers do a request-by-request tracking analyses of their applications, compiling data into a visual "service graph" where they can easily view the connections between the different components in their applications and identify where errors occur. It gives a more detailed look into an application's processes than traditional metrics, according to Vogels.
With X-Ray, developers can "dive inside the application to see how all the components are working together," he said. "You can visualize call graphs, you can see exactly where performance bottlenecks are, you can pinpoint individual services that are maybe giving you issues."
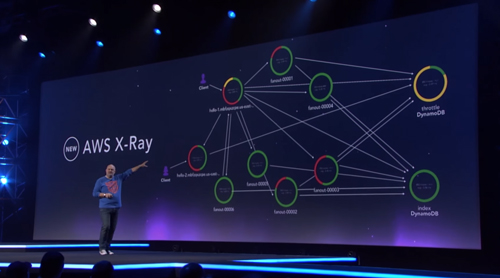 Amazon CTO Werner Vogels announcing the AWS X-Ray service at re:Invent on Thursday.
As AWS evangelist Jeff Barr explained in a detailed blog post, "X-Ray captures trace data from code running on EC2 instances (including ECS containers), AWS Elastic Beanstalk, Amazon API Gateway, and more. It implements follow-the-thread tracing by adding an HTTP header (including a unique ID) to requests that do not already have one, and passing the header along to additional tiers of request handlers. The data collected at each point is called a segment, and is stored as a chunk of JSON data. A segment represents a unit of work, and includes request and response timing, along with optional sub-segments that represent smaller work units (down to lines of code, if you supply the proper instrumentation). A statistically meaningful sample of the segments are routed to X-Ray (a daemon process handles this on EC2 instances and inside of containers) where it is assembled into traces (groups of segments that share a common ID). The traces are segments are further processed to create service graphs that visually depict the relationship of services to each other."
Those interested in testing out X-Ray can sign up for the preview here.
More from re:Invent 2016