AWS Step-by-Step
Tracking EC2 Instance Usage with AWS Reporting Engines
Spinning up new VMs on a whim has little impact in on-premises environments, but it can mean added charges in the cloud. Using AWS instance reports can help organizations keep an eye on those costs and control VM sprawl.
When on-premises server virtualization first became a mainstream technology, it didn't take long before we started hearing about the perils of virtual machine (VM) sprawl. The idea was that VM creation became so easy and inexpensive, that there was little incentive for IT pros to restrain themselves from creating VMs on an as-needed basis.
Today, of course, many organizations create their new VMs in the cloud, and the old practice of creating VMs on a whim may not be such a good idea.
As previously noted, there were no real consequences to creating VMs on-premises. Sure, you might tie up some hardware resources, and VM management might get a little bit more complicated as the number of VMs grows, but there wasn't usually much of a financial impact associated with creating new VMs.
Things are different in the cloud. Providers such as Amazon Web Services (AWS) bill their customers for the resources that they consume. This means that if a VM is created on a whim and then later abandoned, that VM may continue to incur costs, long after it has outlived its usefulness.
Thankfully, AWS provides its customers with a reporting engine that can help administrators keep tabs on Elastic Compute Cloud (EC2) instances. To access this reporting engine, log in to the AWS console, go to the EC2 dashboard, and then click on the Reports option. As you can see in Figure 1, AWS provides two different types of EC2 reports. EC2 Reserved Instance Utilization Reports, which I wrote about here, are designed to show you your level of utilization for reserved instances. The other option is the EC2 Instance Usage Report.
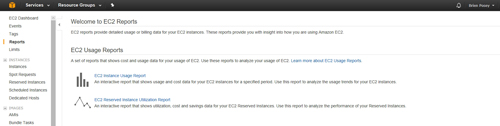 [Click on image for larger view.] Figure 1: AWS provides an EC2 Instance Usage Report.
If you click on the EC2 Instance Usage Report option, you will be taken to a screen that is similar to the one that is shown in Figure 2.
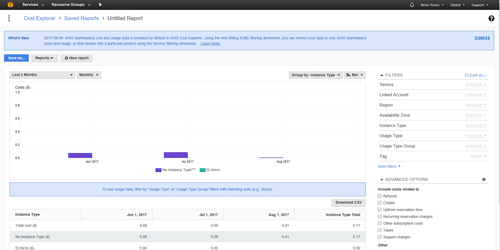 [Click on image for larger view.] Figure 2: This is the main report screen.
As you look at Figure 2 above, the first thing that you will probably notice is the bar graph. This graph displays the EC2 instance costs for the last three months. Here, you can see at a glance that I am not exactly a big spender, because my total EC2 instance cost has been under $0.20 for each of the last three months.
As useful as this view may be, there are other options. If you look just above the graph, you will notice that there are some drop-down menus that allow you to adjust the period of time for which data is displayed. In Figure 3, for example, I have adjusted the view so that it reflects my instance usage for the entire year to date. It is also worth noting that AWS gives you the option of viewing daily usage patterns as opposed to monthly usage.
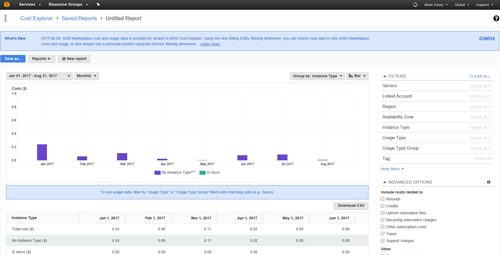 [Click on image for larger view.] Figure 3: You can view usage data for a custom date range.
AWS also gives you the ability to filter the data that is displayed on the chart. If you look back at the Figures 2 and 3, you will notice that the chart's legend indicates that the purple bars represent the cost of VMs for which no instance type has been specified. Green bars, on the other hand (which there aren't any), represent the cost of t2.micro images.
The reason why there are no green bars is because I am using the free tier, and so I was not charged for the t2.micro instances that I created. For the sake of example, however, let's assume that there were some costs associated with these instances, and we wanted to filter the view to show only the micro instances.
To filter the view in this way, click on Instance Type within the Filters section, and then select the t2.micro option, as shown in Figure 4. You will notice in the figure that AWS tells me that there has only been one t2.micro instance. Once the filter is set, click the Apply Filters button and the filter will be applied.
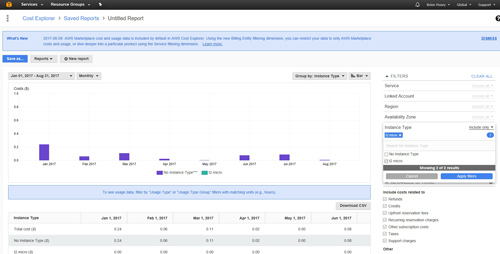 [Click on image for larger view.] Figure 4: AWS lets you filter by instance type.
There are two more things on the Reports screen that are worth paying attention to. First, check out the Advanced Options section that is shown in Figures 2 and 3. You can use these Advanced Options to break down the costs by type. For example, you could use the Advanced Options to find out how much you are paying in taxes, support charges or reservation fees.
The other thing that I want to point out is the Reports drop-down, found in the upper-left portion of the screen. You can use this drop-down menu, which you can see in Figure 5 below, to display costs based on things such as linked accounts or services.
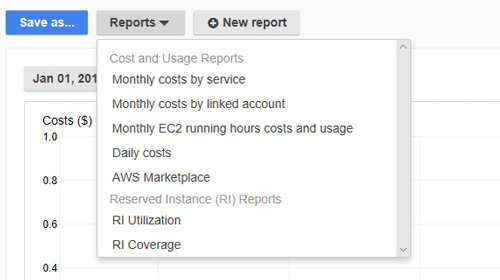 Figure 5: AWS lets you break down the cost by service or by linked account.
As you can see, the instance reports contain a lot of great information. Although these reports will not directly help you to identify abandoned or underused instances, they can help you to keep an eye on EC2-related costs, which may lead you to look for ways of trimming your instance usage.
About the Author
Brien Posey is a 22-time Microsoft MVP with decades of IT experience. As a freelance writer, Posey has written thousands of articles and contributed to several dozen books on a wide variety of IT topics. Prior to going freelance, Posey was a CIO for a national chain of hospitals and health care facilities. He has also served as a network administrator for some of the country's largest insurance companies and for the Department of Defense at Fort Knox. In addition to his continued work in IT, Posey has spent the last several years actively training as a commercial scientist-astronaut candidate in preparation to fly on a mission to study polar mesospheric clouds from space. You can follow his spaceflight training on his Web site.